Motor Vehicle Accidents
Australian Road Death Statistics 2021


The Australian Road Deaths Database is updated monthly to keep a running record of fatalities in all Australian states and territories. This article gives a statistical overview of the data from the first half (H1) of 2021, as well as trends over a ten year period (2011-2021).
Statistics in brief
- Overall Australian road deaths fell to their lowest level for 10+ years in 2020
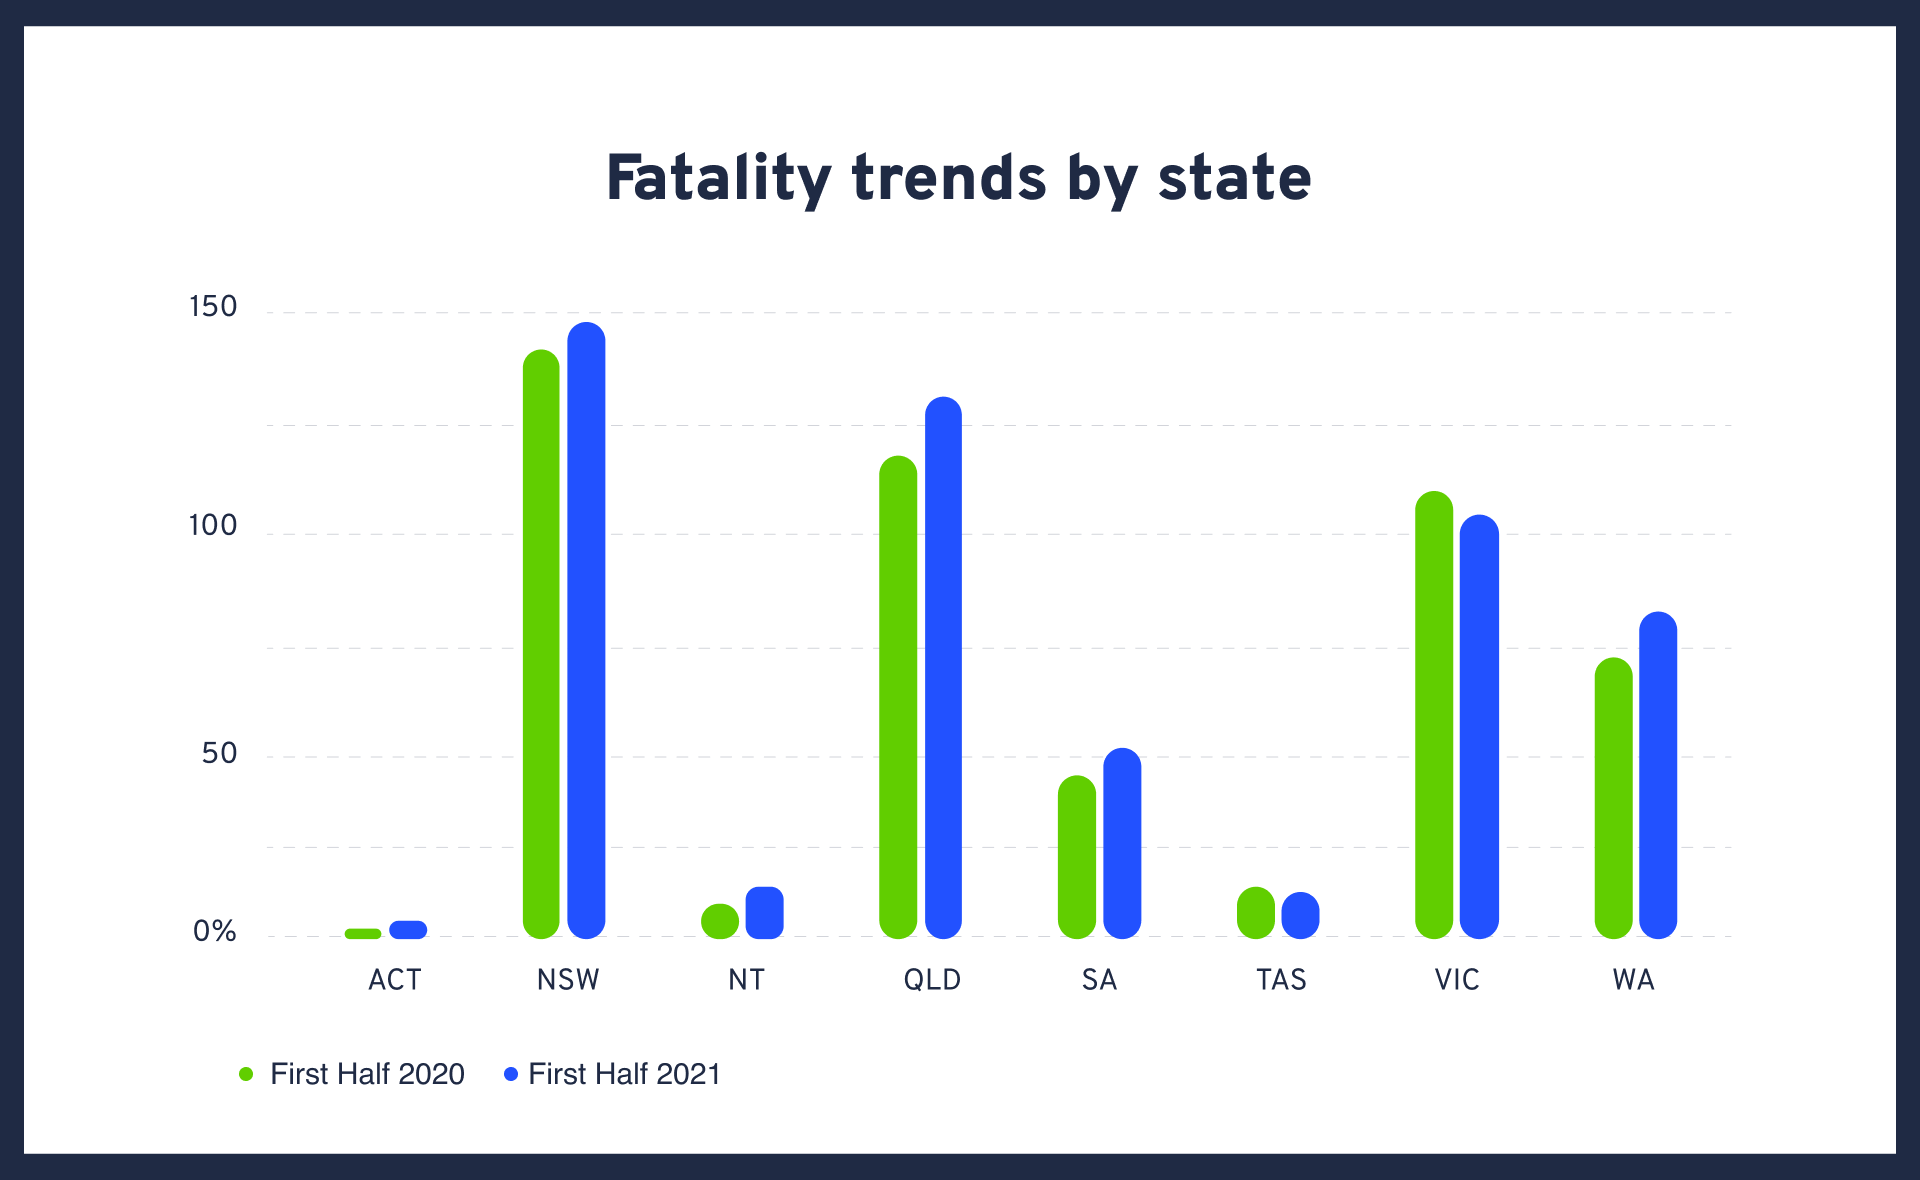
- H1 2021 road deaths are up 7.5% from 2020
- Motorcyclist fatalities have risen 42% year on year and are now at their highest in 10+ years
- 76% of all road deaths were male in H1 2021
- Cyclist deaths fell 36% in H1 2021 compared to H1 2020
Overarching Australian road fatality trends
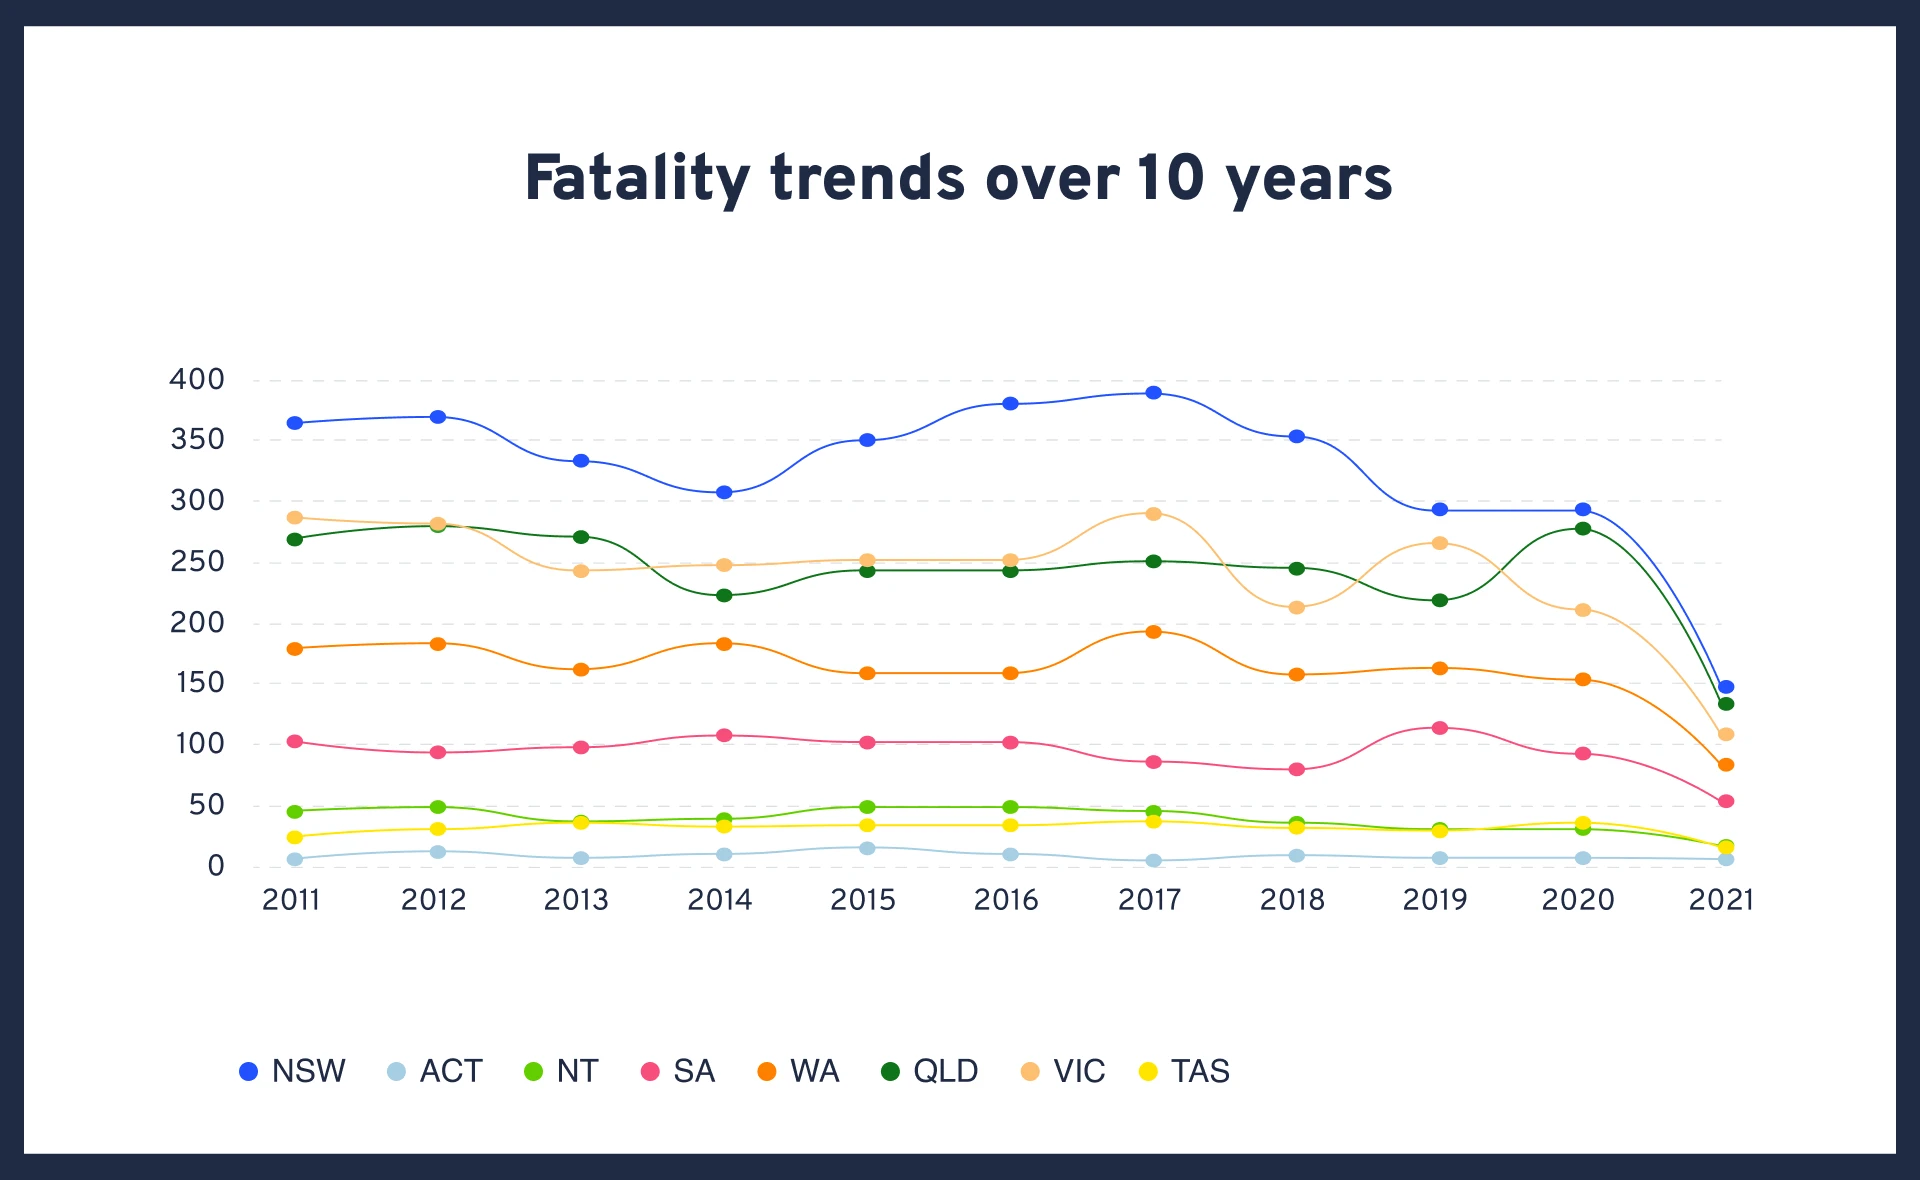

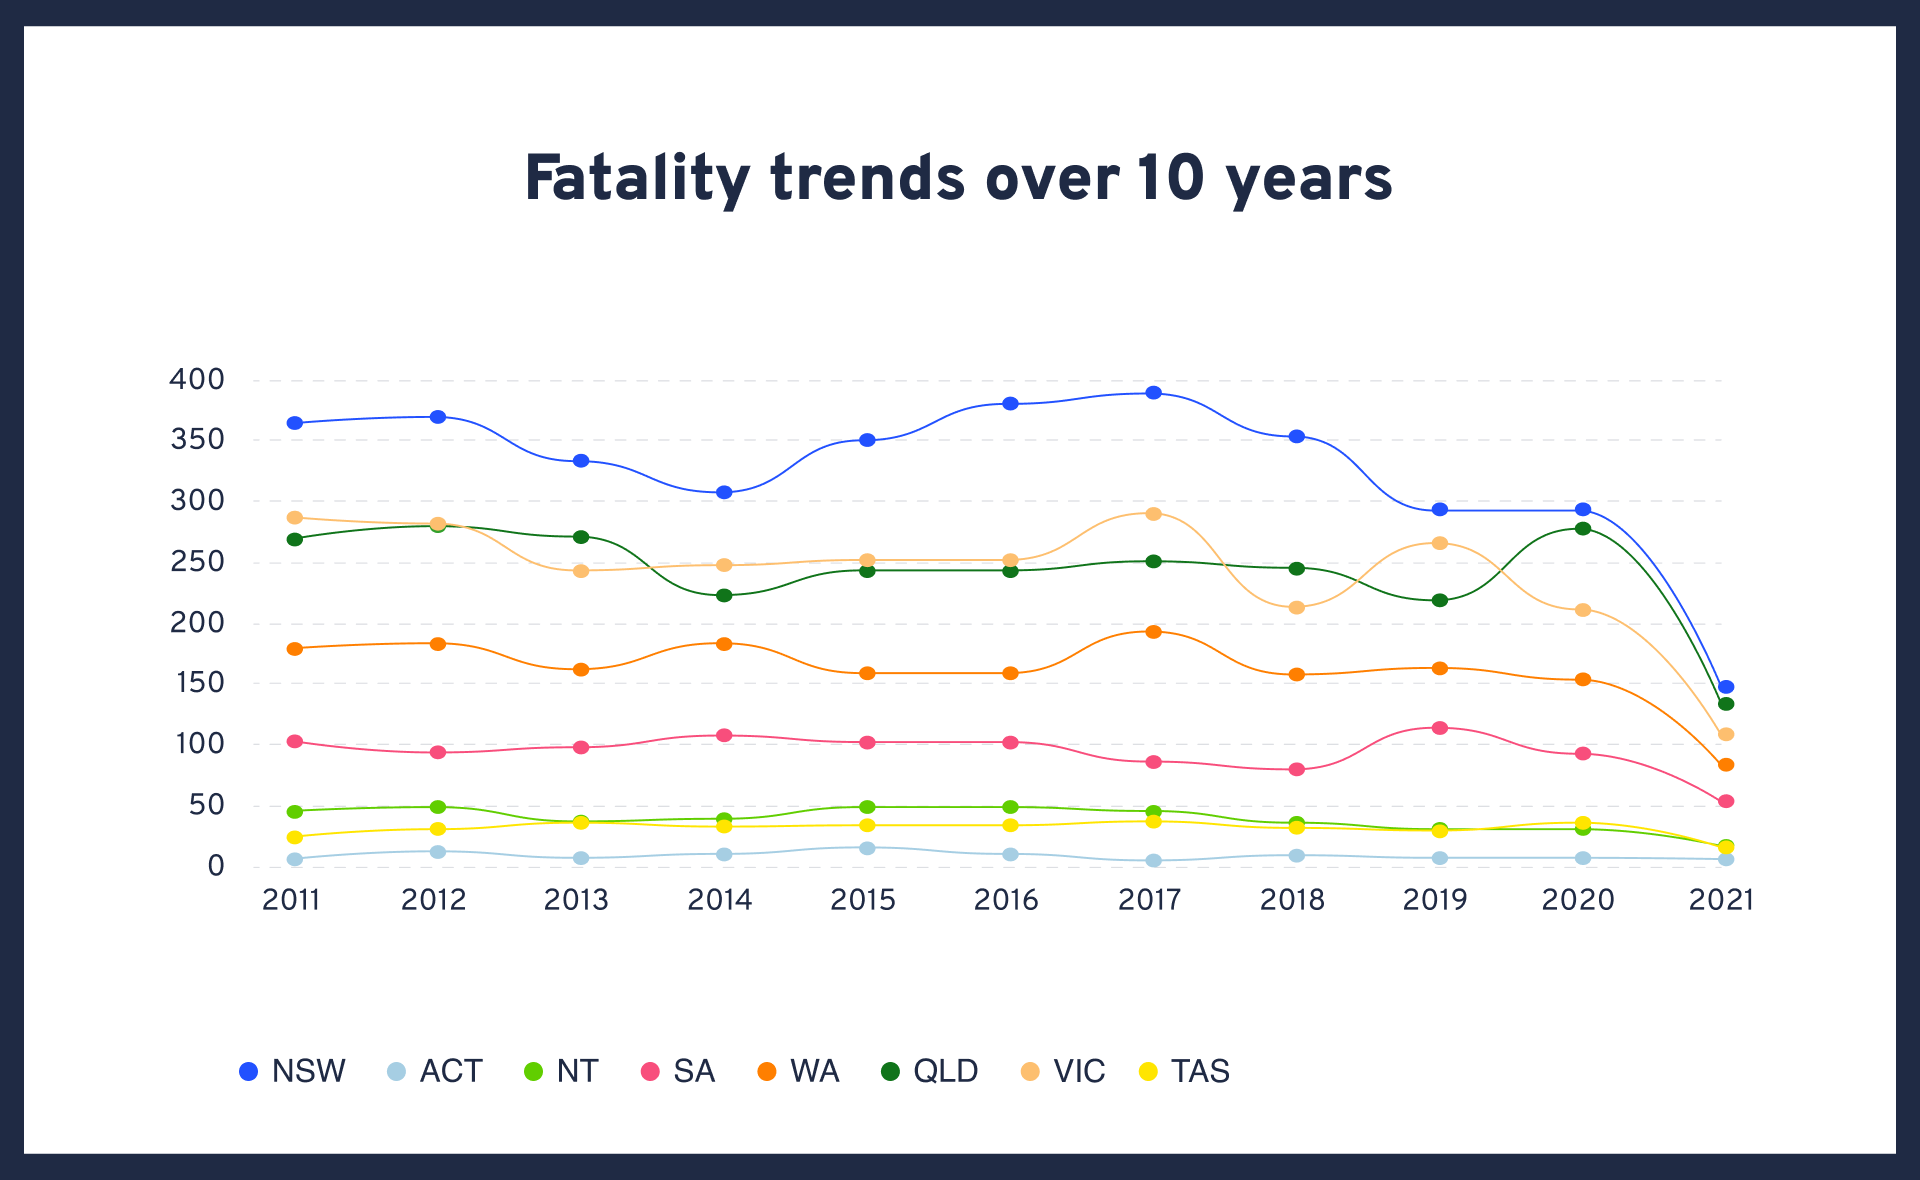
2020 recorded the lowest number of Australian road fatalities since at least 2010 (1,103). The first half of 2021, however, saw 562 deaths – an increase of 7.5% when compared with H1 2020. June 2021 alone saw 98 deaths – an 18% jump from June 2020.
COVID-19 lockdowns may well have been a factor in 2020’s lower death rate, as the rise throughout H1 2021 roughly corresponds with a move back to offices and daily commutes. With this in mind, the reinstated lockdown conditions in Eastern states may well reduce overall numbers once again – especially given that 50% of fatal accidents in H1 2021 occurred in QLD and NSW.
June 2021 also saw a 4% month on month increase in total Australian road fatalities. This was driven largely by a 100% increase in passenger deaths (up from 12 to 24 for the month). All other types of road users saw a decrease, with driver deaths falling 10%, motorcyclists down 7% and cyclists down 50%.
2021’s most at-risk road users
Car and truck drivers still account for the majority of Australian road deaths, making up 49% of the total in the first half of 2021. With 274 deaths behind the wheel, this marked a 17% YOY increase from the previous period, however one still roughly in line with the 10 year average of 269 deaths per H1.
Motorcyclist fatalities, however, were up by 42% and the highest recorded in 10 years. This was a direct counter to the 36% fall in pedal cyclist deaths; particularly surprising given that COVID-19 lockdowns encouraged more Australians to pursue cycling as a form of exercise.
10 year averages for Australian road deaths
Examining ten years of Australian road accident data, from 2011-2021, also revealed some surprising trends.
Road fatalities by day of the week
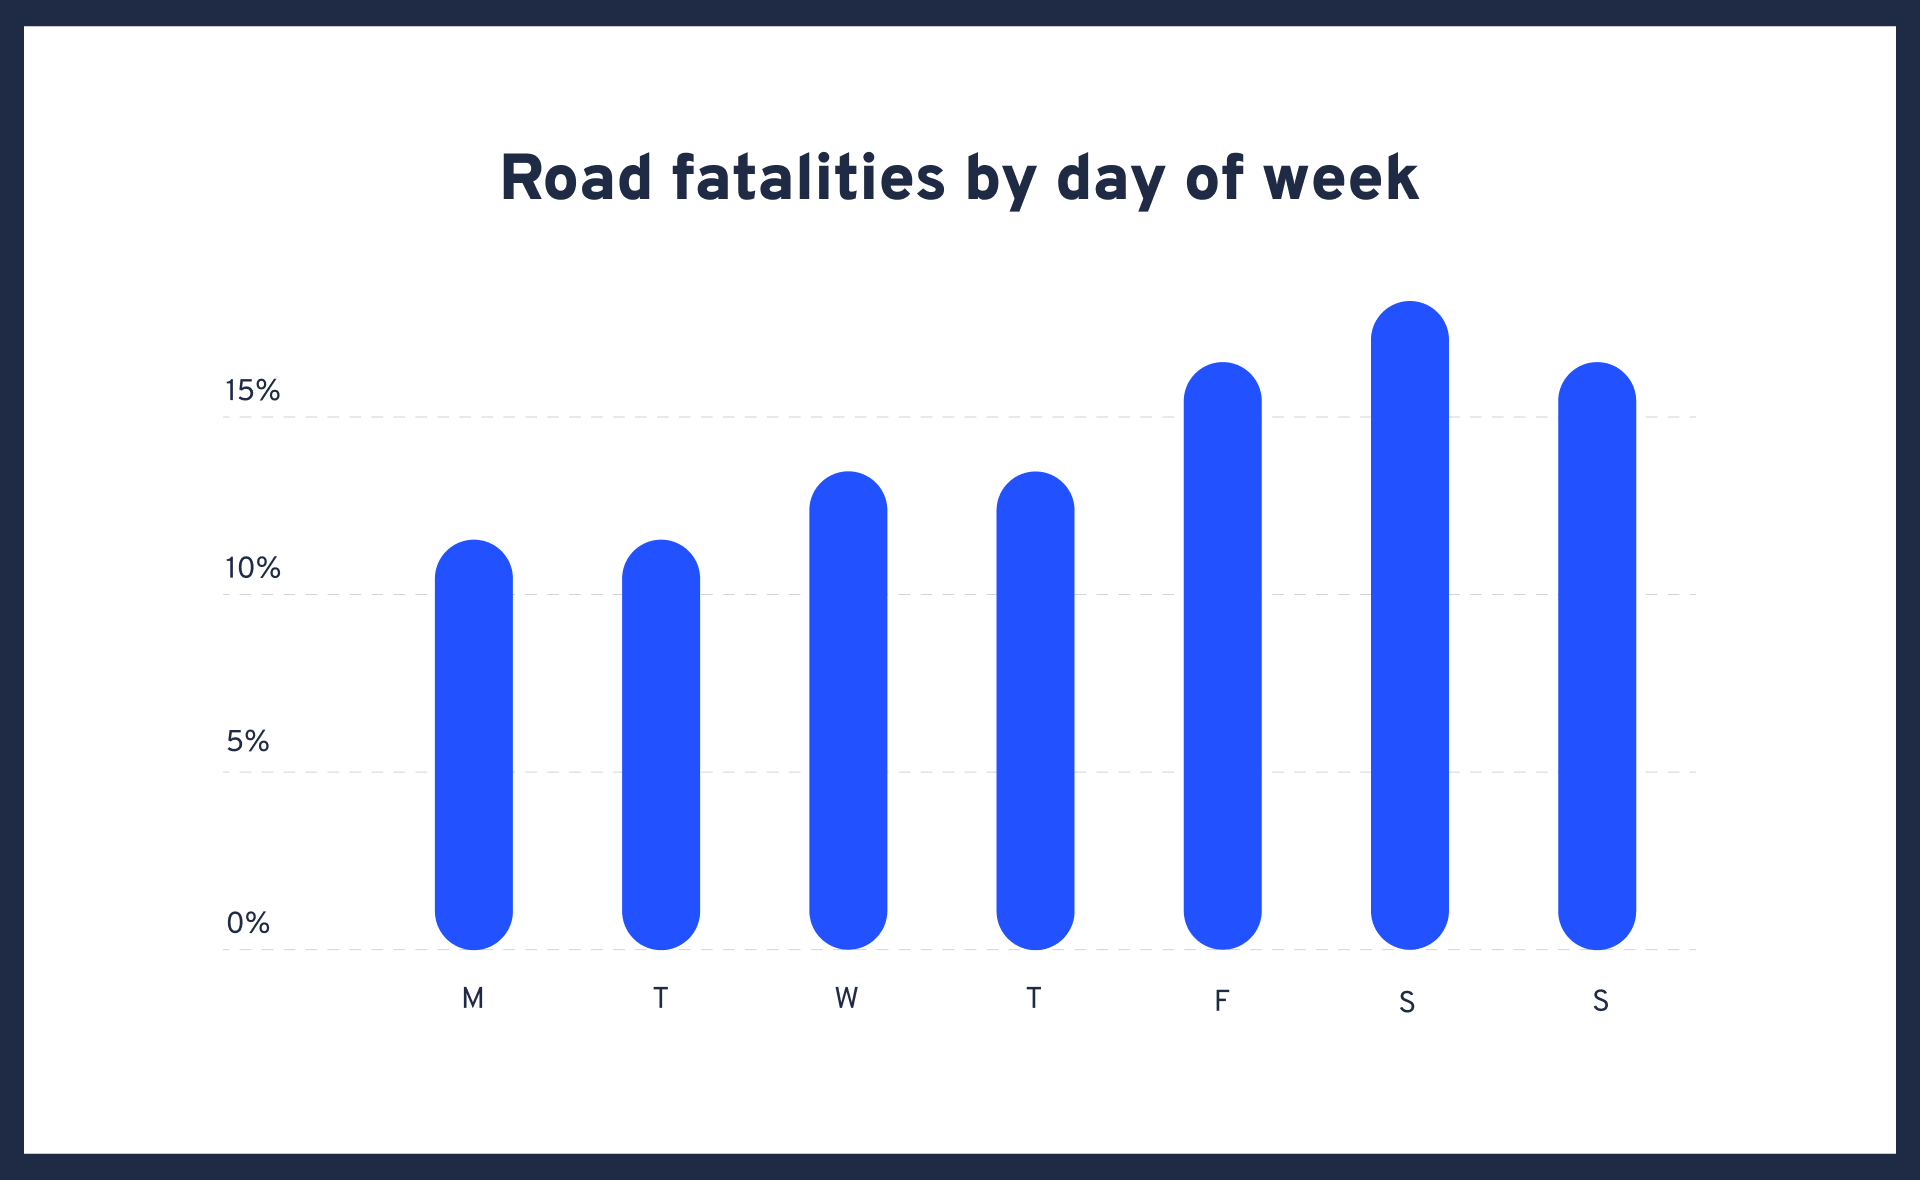
| Monday | Tuesday | Wednesday | Thursday | Friday | Saturday | Sunday |
| 12% | 12% | 13% | 13% | 16% | 18% | 16% |
Unsurprisingly, weekends remain the most dangerous time on Australian roads – with 17.6% of fatal accidents occurring on Saturday. By contrast, drivers appear to exercise more caution in the beginning of the week, with data suggesting that Monday is the safest day on the road, closely followed by Tuesday and Wednesday.
Different days of the week also seem more dangerous for different road user groups. Perhaps owing to the popularity of scenic Sunday cruises, 21% of motorcycle deaths occur on Sunday. For cyclists however, Wednesday and Thursday are the most dangerous times to ride, with 16% of deaths occurring on each of those days.
Road fatalities by time of day
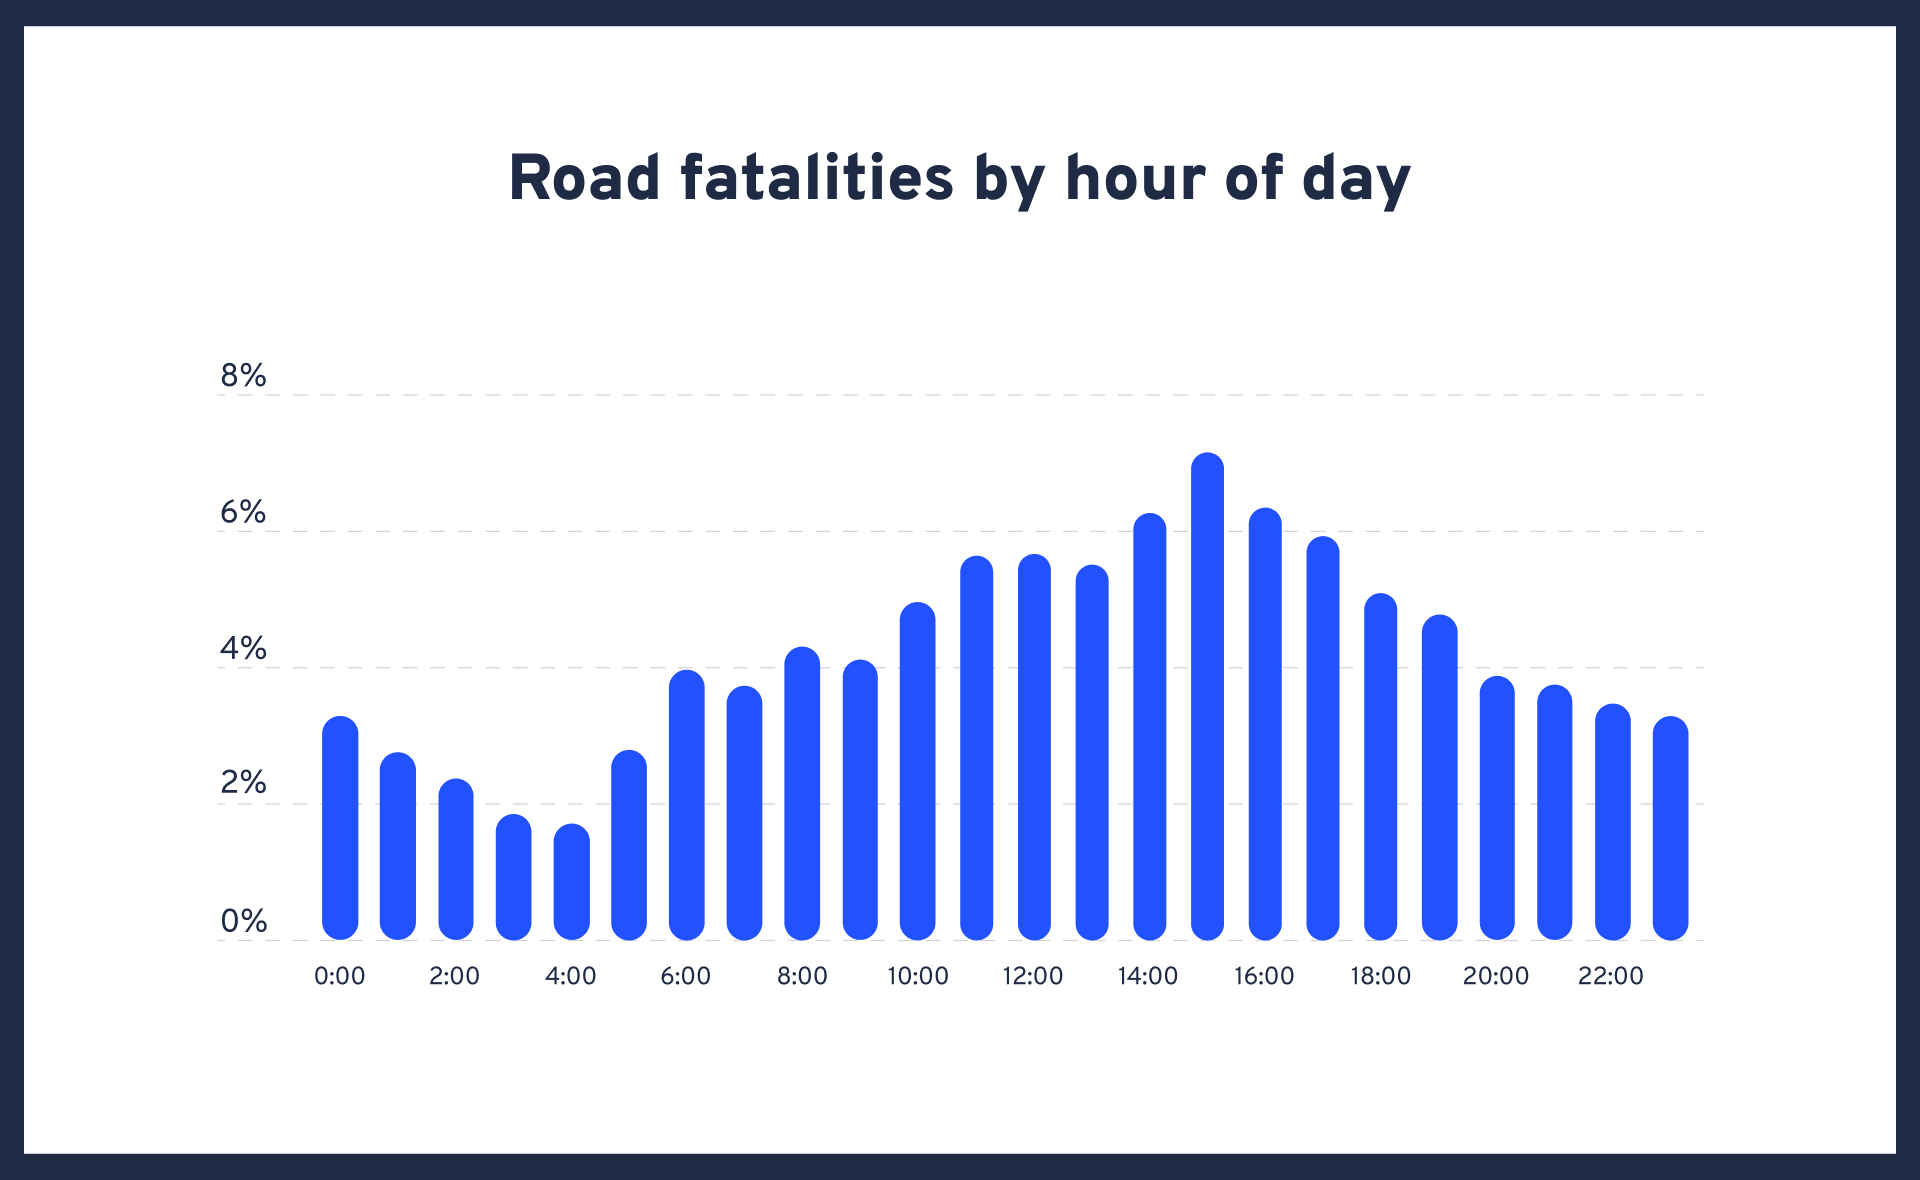
| 0:00 | 1:00 | 2:00 | 3:00 | 4:00 | 5:00 | 6:00 | 7:00 | 8:00 | 9:00 | 10:00 | 11:00 |
| 3% | 3% | 2% | 2% | 2% | 3% | 4% | 4% | 4% | 4% | 5% | 5% |
| 12:00 | 13:00 | 14:00 | 15:00 | 16:00 | 17:00 | 18:00 | 19:00 | 20:00 | 21:00 | 22:00 | 23:00 |
| 5% | 5% | 6% | 7% | 6% | 6% | 5% | 5% | 4% | 4% | 3% | 3% |
The afternoon peak hour of 3-4pm is the most dangerous driving time according to Australian road accident statistics, with 7% of all fatal accidents happening in that hour. 67% more accidents occur at this time than during the morning peak of 8-9 AM, likely pointing to the role that fatigue plays in many crashes.
For cyclists, however, the chaos of the morning commute is more dangerous. 27% of cyclist fatalities occur between 6-9 AM. Pedestrians, on the other hand, are statistically more likely to be involved in a fatal accident between 7-8 PM.
As could be predicted, the safest hours on Australian roads are those that attract the fewest drivers, between 9 and 4 AM.
Road fatalities by age
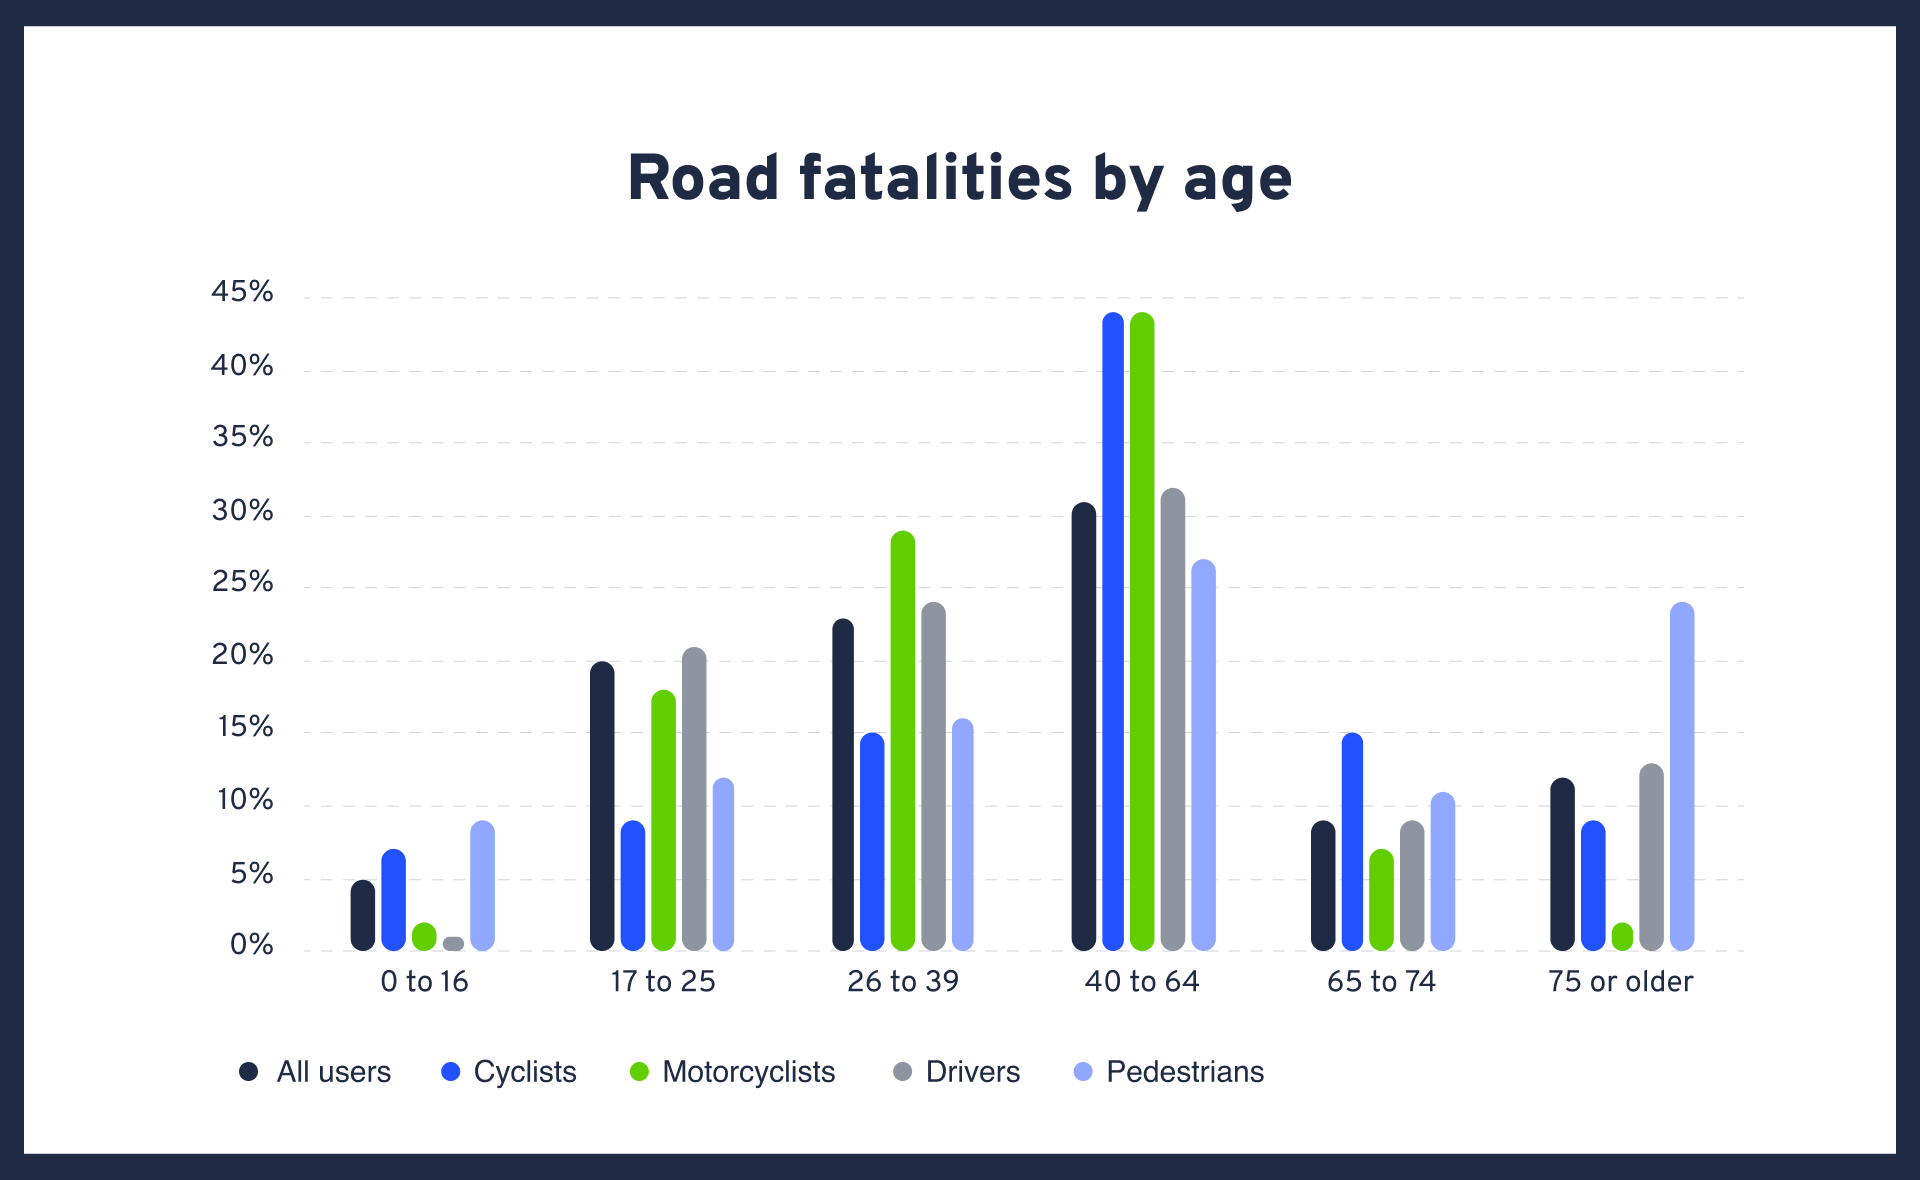
| 0 to 16 | 17 to 25 | 26 to 39 | 40 to 64 | 65 to 74 | 75 + |
| 5% | 20% | 23% | 31% | 9% | 12% |
Road users aged 40-64 have made up 31% of all Australian road fatalities in the last 10 years. This segment increases among cyclists and motorcyclists, where 44% of deaths are Generation X or Baby Boomers.
Shockingly, the first half of 2021 has seen 33 Australian road deaths of people aged 16 and under; a 48% YOY increase. Deaths of those aged 65-74 also saw a 67% increase – proof of the need for comprehensive training and retraining for young and old drivers.
Data also reveals that seniors are the most likely to suffer a fatal injury while using roads on foot. 24% of all pedestrian deaths are aged 75 and over, with the elderly less likely to hear or see oncoming vehicles.
Road fatalities by gender
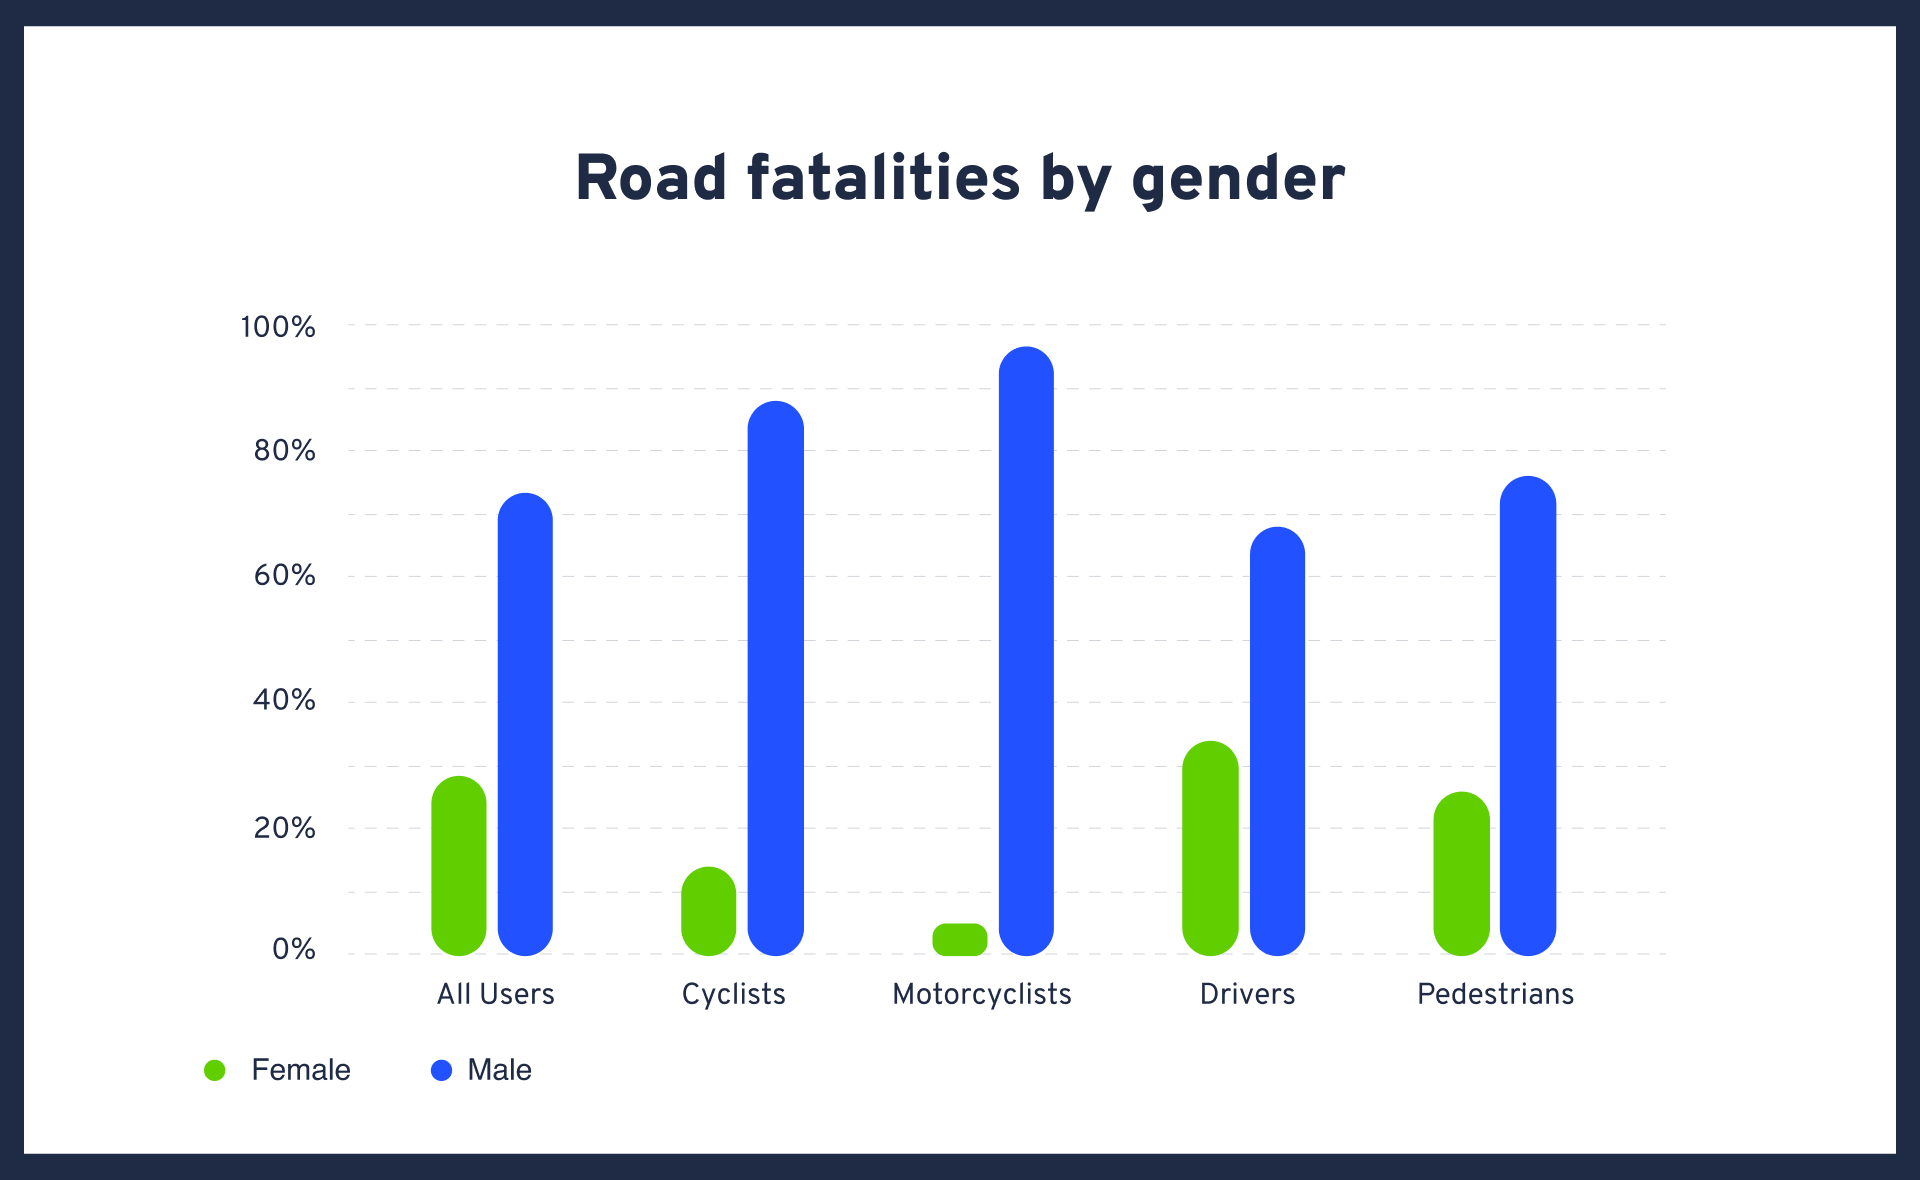
| Female | .Male. |
| 27% | 73% |
Data from the past 10 years appears to suggest that men are more prone to risky behaviour on Australian roads than women. They account for the overwhelming majority of Australian road deaths in the past ten years, making up 73% of the total number (76% so far in 2021). Men are even more disproportionately represented in bike and motorcycle accidents, where they have made up 96% and 87% of total fatalities over the past 10 years.
Road fatalities by road type
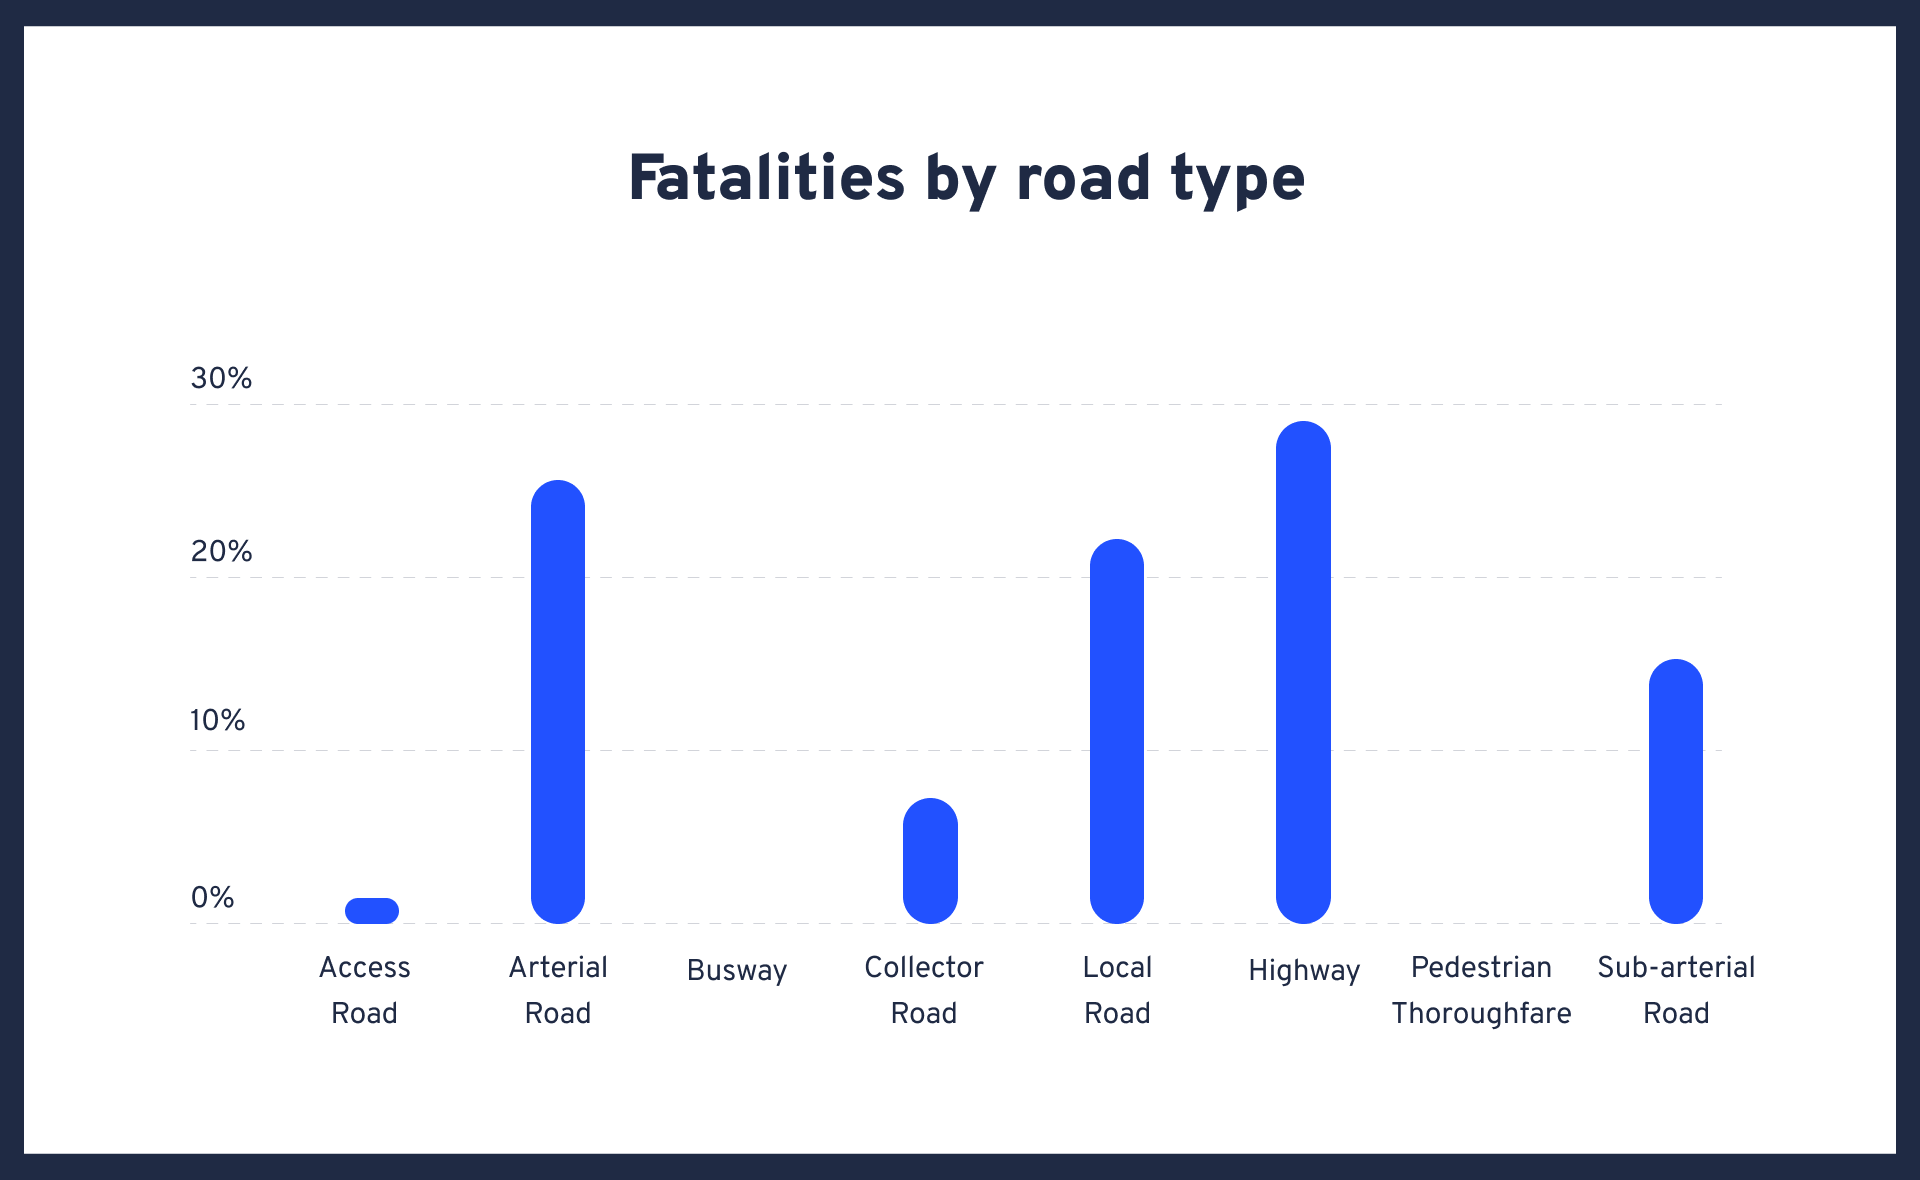
| Access Road | Arterial Road | Busway | Collector Road | Local Road | National/State Highway | Pedestrian Thoroughfare | Sub-Arterial Road |
| 1% | 26% | 0% | 7% | 21% | 29% | 0% | 15% |
Over the past 10 years, national or state highways have consistently been Australia’s most deadly roads, responsible for 29% of all fatal crashes. This trend has continued in 2021 with 27% of fatalities taking place on these high-speed roads – a clear majority when compared to other road types.
Despite this, analysis of Jan-June highways data over the past 10 years reveals that this year has seen the lowest percentage of fatal crashes since 2017 (12.67% in 2021 vs 12.18% in 2017).
A 10 year analysis of Jan-June data also highlights arterial roads are particularly dangerous for motorcycle riders, with 26% of all fatal motorcycle crashes taking place on this road type. In 2021 however, only 7% of motorcycle fatalities have occurred on arterial roads – the lowest percentage since this data started being recorded in 2014.
Road fatalities by speed
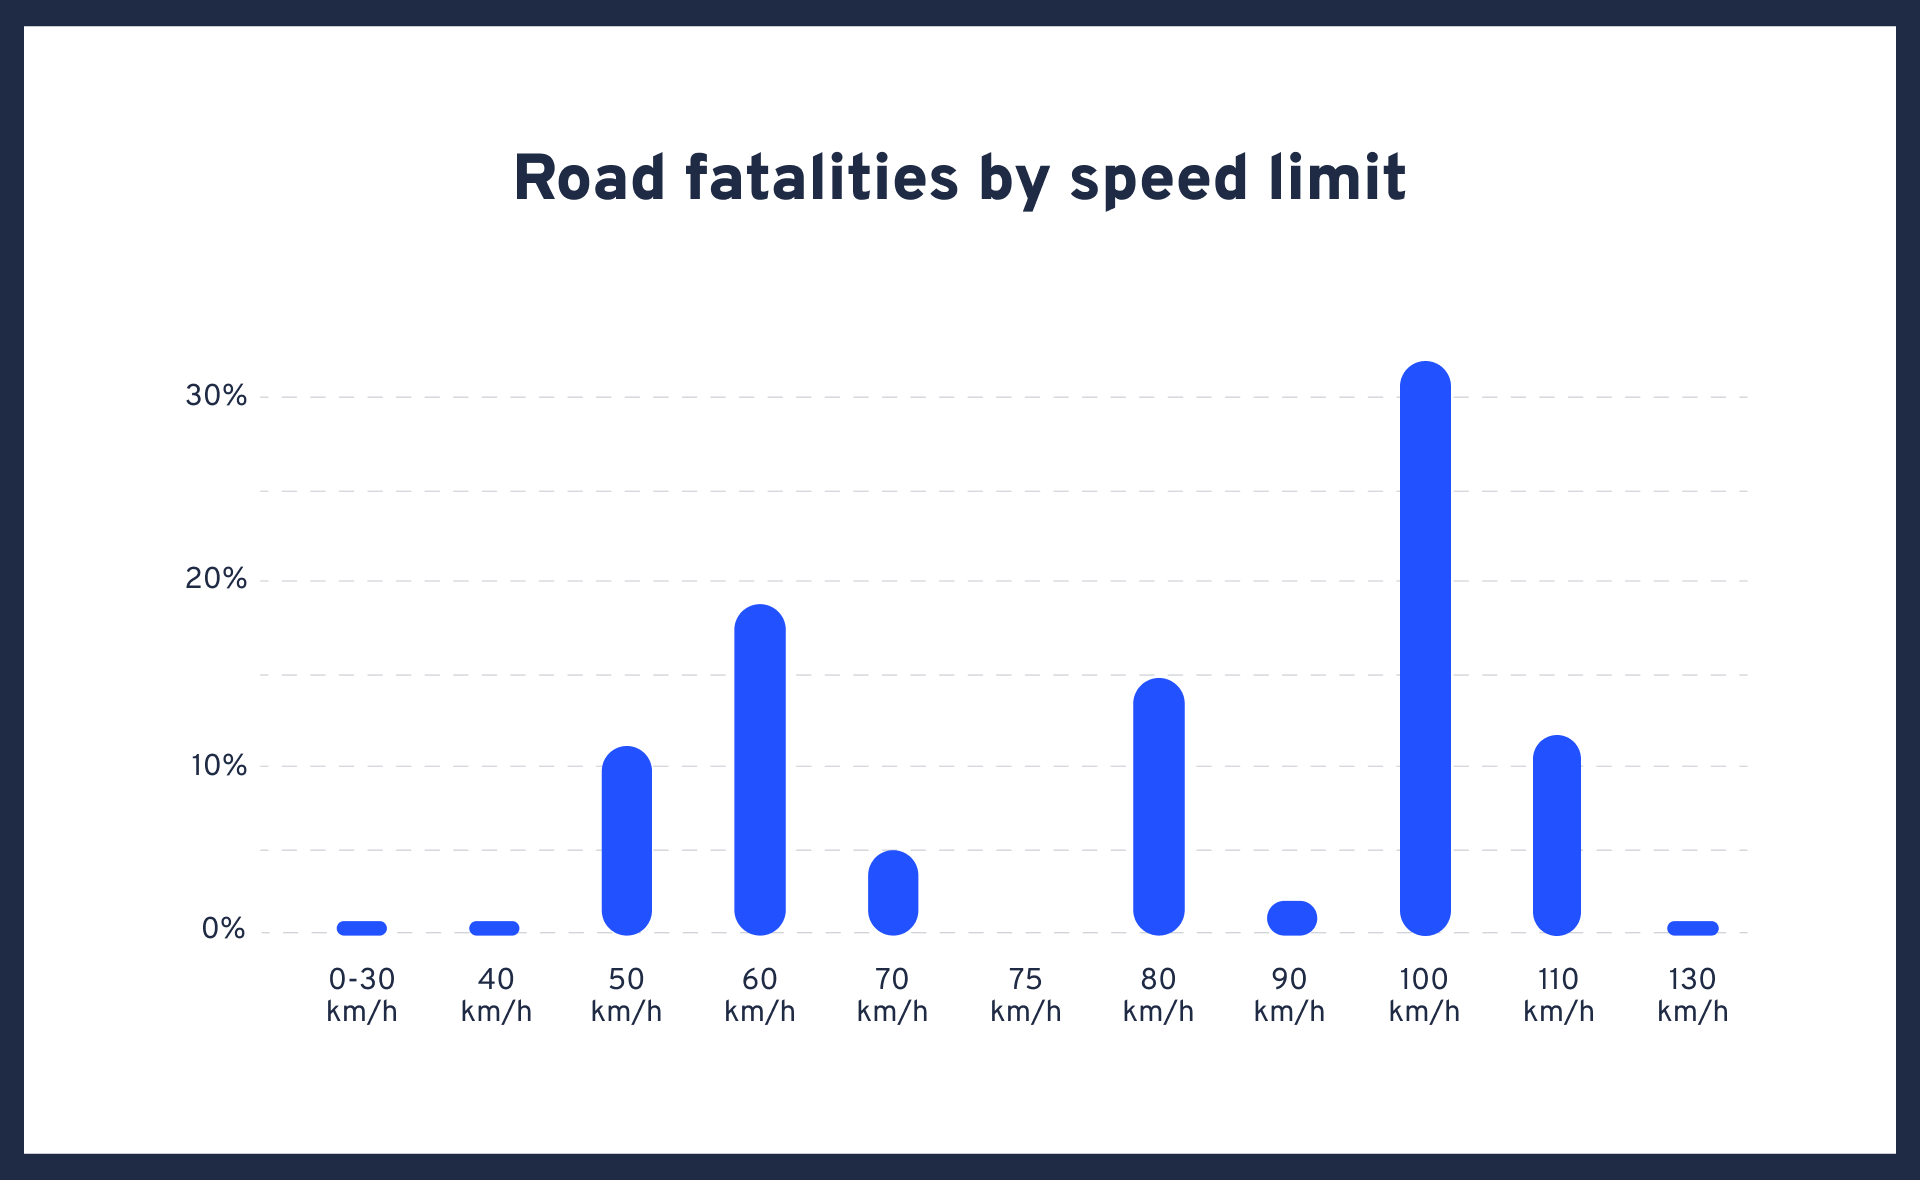
| 30 km/h (or under) | 40 km/h | 50 km/h | 60 km/h | 70 km/h | 75 km/h | 80 km/h | 90 km/h | 100 km/h | 110 km/h | 130 km/h |
| 1% | 1% | 11% | 17% | 5% | 0% | 15% | 2% | 33% | 13% | 1% |
The most dangerous road speed is 100kmph, causing 33% of fatal crashes in the past 10 years according to Australian road death statistics. This in turn explains why Australia’s most deadly roads are invariably national or state highways with higher speed limits, where 29% of all fatal crashes occur on average.
Cities versus regional and remote areas
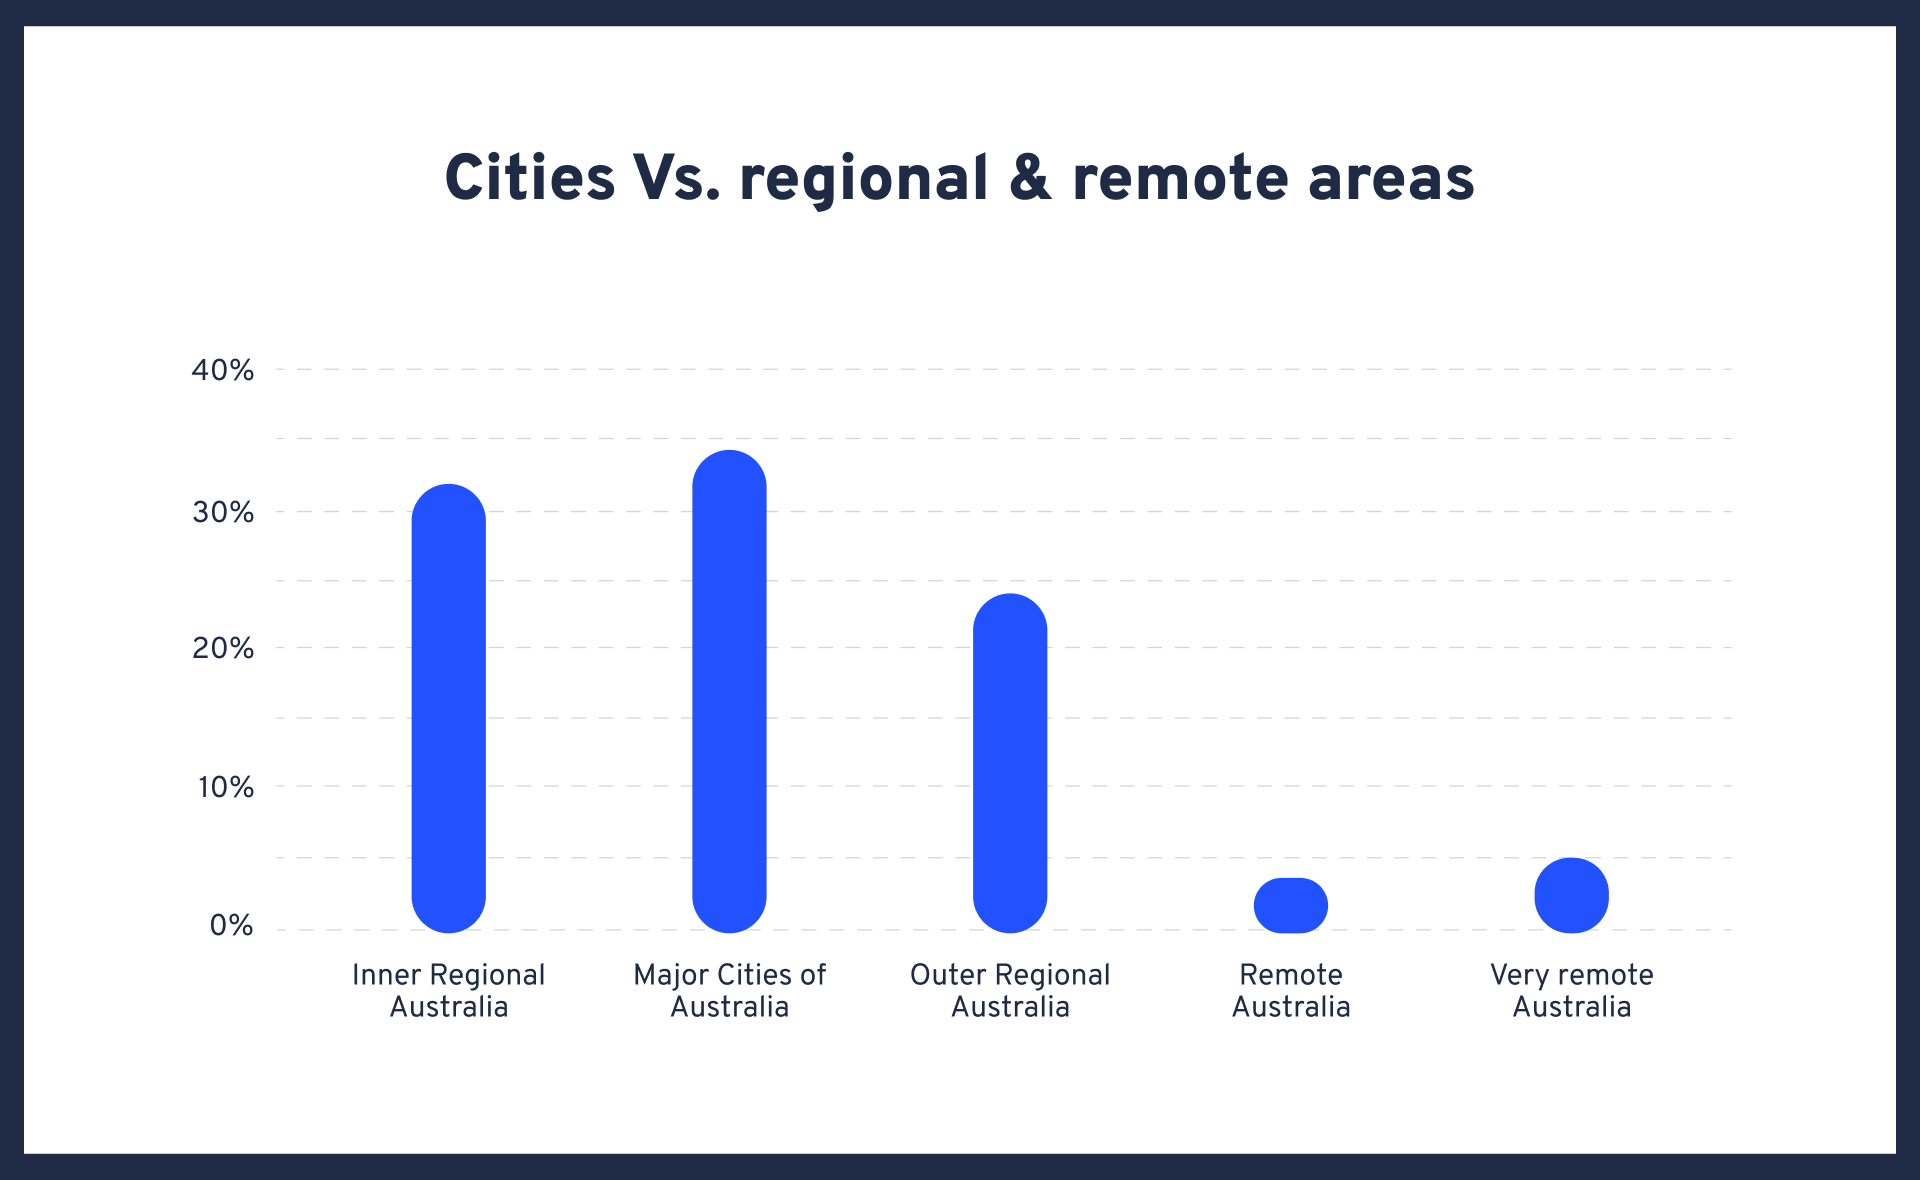
| Inner Regional Australia | Major Cities of Australia | Outer Regional Australia | Remote Australia | Very Remote Australia |
| 32% | 34% | 24% | 4% | 5% |
Given their heavy traffic, it’s no surprise that major cities have seen the highest proportion of Australian road fatalities over the past 10 years (34%). At the same time, however, the first 6 months of 2021 saw a marked increase in fatal crashes in inner regional Australia (35.98% of fatal accidents so far).
Comparing Road Users
The following section shows the % of deaths of major road users (and all road users) against a number of criteria.
Comparing Road Users: Day of Week
| Day of Week | All Road Users | Motorcyclists | Pedal Cyclists |
| Monday | 12% | 10% | 12% |
| Tuesday | 12% | 11% | 15% |
| Wednesday | 13% | 11% | 16% |
| Thursday | 13% | 12% | 16% |
| Friday | 16% | 14% | 11% |
| Saturday | 18% | 20% | 15% |
| Sunday | 16% | 21% | 14% |
Comparing Road Users: Time of Day
| Time of Day | All Road Users | Motorcyclists | Pedal Cyclists |
| 0:00 | 3% | 2% | 1% |
| 01:00 | 3% | 2% | 0% |
| 02:00 | 2% | 1% | 0% |
| 03:00 | 2% | 1% | 1% |
| 04:00 | 2% | 0% | 1% |
| 05:00 | 3% | 1% | 3% |
| 06:00 | 4% | 3% | 8% |
| 07:00 | 4% | 3% | 8% |
| 08:00 | 4% | 3% | 11% |
| 09:00 | 4% | 5% | 7% |
| 10:00 | 5% | 5% | 7% |
| 11:00 | 5% | 7% | 5% |
| 12:00 | 5% | 8% | 3% |
| 13:00 | 5% | 7% | 3% |
| 14:00 | 6% | 8% | 5% |
| 15:00 | 7% | 8% | 6% |
| 16:00 | 6% | 8% | 7% |
| 17:00 | 7% | 7% | 6% |
| 18:00 | 5% | 5% | 6% |
| 19:00 | 5% | 4% | 3% |
| 20:00 | 4% | 3% | 3% |
| 21:00 | 4% | 3% | 3% |
| 22:00 | 3% | 3% | 1% |
| 23:00 | 3% | 2% | 1% |
Comparing Road Users: Speed
| Road Speed | All Road Users | Motorcyclists | Pedal Cyclists |
| 30km/h (or under) | 1% | 1% | 2% |
| 40km/h | 1% | 2% | 2% |
| 50km/h | 11% | 14% | 23% |
| 60km/h | 17% | 24% | 19% |
| 70km/h | 5% | 6% | 5% |
| 80km/h | 15% | 19% | 15% |
| 90km/h | 2% | 2% | 1% |
| 100km/h | 33% | 27% | 17% |
| 110km/h | 13% | 5% | 4% |
| 40km/h | 1% | 0% | 0% |
Comparing Road Users: Geographical Area
| Geographical Area | All Road Users | Motorcyclists | Pedal Cyclists |
| Inner Regional | 32% | 33% | 16% |
| Major Cities | 34% | 42% | 69% |
| Outer Regional | 24% | 21% | 10% |
| Remote Australia | 4% | 2% | 2% |
| Very Remote Areas | 5% | 3% | 3% |
Injured in a Road Accident?
If you’ve been injured in a Motor Vehicle Accident, LHD Lawyers can secure you the compensation you need to get back on your feet. We win, or you don’t pay. Call 1800 455 725 for a no-obligation consultation about your case.
Data Source: https://data.gov.au/data/dataset/5b530fb8-526e-4fbf-b0f6-aa24e84e4277
Author: James Bodel

Check if you’re eligible or get free claim advice now
Other Insights you may be interested in